The Perfect Storm: Exploring how sea level rise and storms intersect
Presenters:
Greg Berman, Coastal Processes Specialist, Woods Hole Sea Grant and Cape Cod Cooperative Extension - The Science of Sea Level Rise and Storms, Presentation Slides
Shannon Hulst, Floodplain Specialist, Woods Hole Sea Grant and Cape Cod Cooperative Extension - Applying the Science: Floodplain Management, Presentation Slides
Date: July 2022
Lesson Plans and Classroom Activities
- Center for Coastal Studies “Coastal Processes and Hazard Mitigation Curriculum Framework”: This includes three DRAFT 7th-grade lessons looking at coastal processes and mitigation on Cape Cod. (See pdf’s in the folder)
- Nauset Regional Middle School grade 7 lesson plan
- Section 1 - “Understanding the sediment movement along Cape Cod Bay”
- Section 2 - “Hazard mitigation from the impacts of storms and sea level rise”
- Monomoy Regional Middle School grade 7 lesson plan
- Section 1 - “Understanding the coastal changes along Chatham’s Shoreline”
- Martha’s Vineyard grade 7 lesson plan (Uses Storm Tide Pathways mapping)
- “Hazard mitigation from the impacts of storms and sea level rise”
- Nauset Regional Middle School grade 7 lesson plan
- Plum Island Ecosystems Long Term Ecological Research Station Data Nuggets: Data Nuggets are designed “to inspire teachers and scientists to bring data from ongoing research into the classroom and take students through the process of science, from the inception of ideas to the analysis and interpretation of data.” These lessons use data, graphing, and exploratory questions to investigate topics. There are teaching guides and grading rubrics.
- Dauphin Island Sea Lab Sea Level Rise Activities: Sea-Level Rise in the Classroom is a four-module curriculum designed for high school teachers to introduce sea-level rise impacts and discuss community-based solutions with their students.
- Module 1 addresses the science behind the sea-level rise and coastal flooding, and the other three highlight pathways towards community resilience through individual and community action. (Includes the workshop demos on thermal expansion and ice melt).
- Module 2 covers natural solutions.
- Module 3 allows students to investigate the role of policy and ordinances.
- Module 4 brings it together through community planning. A capstone project allows students to explore simulated towns and create resilience plans.
- For all other document formats, supplemental materials, and PowerPoints please visit the curriculum’s Google Drive folder.
- Dauphin Island Sea Lab Lesson on Living Shorelines: These lessons explore oysters, oyster reefs, restoration, and living shorelines.
- “Building an Oyster Reef: A 3-D Activity” - This elementary school activity (2-5) has the students exploring oyster reefs, their ecosystem benefits, coastal erosion, and making a paper model of an engineered reef.
- “Living Shorelines” - This middle school lesson has students exploring sources of erosion, methods of shoreline stabilization, and experimenting with creating their own living shoreline.
- “Restore It? A Lesson on Restoration Ecology” - This high school lesson has students exploring degraded habits and exploring restoration projects.
- Dauphin Island Sea Lab Storm Surge Game: This webpage includes lesson plans, interactive activities, PowerPoint presentations, and an interactive game that help students gain a better understanding of the coastal hazards of hurricanes and associated storm surge, as well as modeling and scientific visualizations. These materials were created by Discovery Hall Programs and the Northern Gulf Coastal Hazards Collaboratory to help communicate the nature of risks associated with living in coastal areas, especially during hurricane events.
- The first lesson, “In the Path of the Storm”, focuses on hurricane science and introduces to students to scientific modeling through short storm surge simulation videos.
- The second lesson, “Visualizing Hurricanes: A multimedia lesson about hurricanes, storm surge, and scientific visualizations from models”, uses Google Earth to showcase storm surge and coastal flooding due to hurricanes. Use this interactive lesson to teach about the value of scientific modeling and flood the streets of coastal Mississippi with a storm surge!
- The third lesson, “Oh Buoy! A data rich lesson plan about Hurricane Katrina and NOAA National Data Buoy Center”, utilizes real-time data as well as historical data to encourage scientific reasoning as well as data interpretation skills. Learn about the role of the National Data Buoy Center in ocean science and scope out some data from different corners of the globe.
- Lastly, the SURGE GAME is an online game that allows students to choose the intensity of their storm and the landfall location along the northern Gulf coast. Students can watch the water levels change as their storm approaches shore and monitor tidal stations.
- Hawai’i Sea Grant Activity, “Designs that Survive Storms”: This 3rd-grade lesson addresses Earth systems and weather patterns. Students explore the phenomena of large storms that bring destructive winds, rain, and storm surge. Students experiment with what materials or building designs help a house survive a storm. How can homes be built, or modified, to keep people dry and safe during strong storms?
- NOAA National Ocean Service Sea Level Rise Learning Module: This lesson informs about sea level rise, its causes, and impacts; and challenges students to think about what they can do in response. This module features an integrated educational package of grade-level-appropriate (6-12) instruction and activities centered on a 23-minute video presentation.
- NOAA “Investigating Sea Level” Lessons: Through the lessons in this module, designed for grades 6-12, students are guided through the use of NOAA data (sea level and tide data from NOAA’s Center for Operational Oceanographic Products and Services) to understand how scientists monitor sea levels in order to determine the effect of sea level changes on coastal communities. The module offers lessons at five different levels, beginning with basic graph interpretation (Levels 1 & 2) and building towards activities that challenge students to ask questions and develop their own data investigations (Levels 4 & 5).
Mapping Tools
- Storm Tide Pathways web app: The mapping of storm tide pathways is one method that can help predict where waters may flow during the next storm, but can also be used to plan ahead for sea level rise. Use this app to change the water level and see the predicted effects in Provincetown, Dennis, or Nantucket.
- NOAA Sea Level Rise Viewer: Use this web mapping tool to visualize community-level impacts from coastal flooding or sea level rise (up to 10 feet above average high tides). Photo simulations of how future flooding might impact local landmarks are also provided, as well as data related to water depth, connectivity, flood frequency, socio-economic vulnerability, wetland loss and migration, and mapping confidence.
- NOAA Tides and Currents: You can choose a state on the map to access local water levels, tide and current predictions, and other oceanographic and meteorological conditions. Some examples of the data on this page are:
- The Coastal Inundation Dashboard: This provides real-time and historical coastal flood information.
- High Tide Bulletin: This shows each region of the U.S. when, where, and why their region may experience higher than normal tides.
- Google Earth Timelapse Cape Cod: Earth timelapse is a global, zoomable video that lets you see how the Earth has changed over the past 37 years.
- Cape Cod Commission’s Sea Level Rise Viewer: You use this tool to see predicted sea level rise scenarios, sea and lake overland surges from hurricanes (SLOSH), as well as the Federal Emergency Management Agency (FEMA) flood rate insurance map (FIRM). Also shown are the town-identified critical facilities for the entire Cape, and the potential effects of sea level rise on the road network.
Background and Resources
- NOAA National Ocean Service 2022 Sea Level Rise Technical Report: This report provides the most up-to-date sea level rise projections available for all U.S. states and territories. The 4 key takeaway messages are summarized (with a link to the full report) in an easy-to-understand way that you can share with your students.
- Available Datasets for Download
- 2022 Scenarios of Future Mean Sea Level
- 2022 Extreme Water Levels (Tide Gauges)
- 2022 Extreme Water Levels (1-Degree Grids)
- Available Datasets for Download
- 2022 Sea Level Rise Technical Report Application Guide: This is for community planners and decision-makers to help them plan for the significant sea level rise in the United States that is expected in the next 30 years. You can do a mock community planning activity with your students using this as your guide.
- A description of the content within the technical report
- An in-depth discussion of items to be considered when planning for sea level rise
- Approaches for integrating the 2022 sea level rise scenarios into community planning initiatives; and
- Additional resources to be used as communities explore the next steps
- US Climate Resilience Toolkit: This has a “Steps to Resilience” framework that describes an approach communities can use to identify their valuable assets, determine which climate-related hazards could harm them, and then identify and take effective actions to reduce their risk. You can use this to make a mock community climate action plan with your students for your town.
- Case Studies: Communities, businesses, and individuals are taking action to document their vulnerabilities and build resilience to climate-related impacts. Click dots on the linked map to preview case studies.
- US Climate Explorer: Explore interactive graphs and compare time-series maps showing climate projections and observations for any county in the contiguous United States. You can also explore historical temperature and precipitation observations at hundreds of climate stations, and view observed and projected days of high-tide flooding at more than 90 coastal tide-gauge stations.
- Coastal Risk Screening Tools: These easy-to-use interactive maps allow you to look at your specific area to see potential sea level rise and flooding effects. Examples of maps include:
- Ice sheet contributions to sea level rise
- Affordable housing that may be impacted by SLR
- What land is at risk year by year based on projections
- Video: Sea-Level Rise & Citizen Science with the Museum of Science, Boston. This has a nice explanation of climate change and sea level rise. They talk about Boston and potential sea level rise implications and how the community might prepare.
WHOI and Woods Hole Sea Grant Resources
- WHOI Report, “Understanding Sea Level Rise”
- “Rising Tides: Preparing for the Future” Webinar: Learn how the Woods Hole Oceanographic Institution (WHOI), Marine Biological Laboratory (MBL), and NOAA’s Northeast Fisheries Science Center (NEFSC) are preparing their ocean-front facilities for sea level rise and storm surge, and how community leaders and government officials from the federal, state, and local levels envision our shared future.
- Three Things you my not Know about Sea Level Rise: Short 50-second video from WHOI with 3 things you need to know about SLR.
Visualizing Sea Level Rise:
- Wrack Line 2050 - This project in Jametown, Rhode Island seeks to community-wide attention to the urgent need to plan for and prepare for rising tides. There is information on SLR, details on community action, and a description of an art installation to demonstrate a predicted wrack line from a nuisance storm in 2050.
- Boston Dance Theatre (BDT) SURGE: BDT performs their art and science project called SURGE which is an ongoing collaboration between BDT and WHOI Senior Scientist, Dr. Larry J. Pratt. SURGE addresses current climate trends through the lens of sea-level rise and the role that art and science play in creating a sustainable future. This performance took place during WHOI’s 2020 Ocean Encounters finale episode entitled Our Enchanted Ocean and was recorded on October 28, 2020.
Workshop Agenda
Friday, July 15, 2022
8:45 – 9:15 -- Arrive WHOI Redfield Auditorium. Breakfast: pastries, coffee, juice, tea, water
9:15 – 9:30 --Introduction to Woods Hole Sea Grant (WHSG) and WHOI
9:30 – 10:30 -- Greg Berman, WHSG and Cape Cod Cooperative Extension
10:30 – 10:45 -- Break
10:45 – 11:45 -- Shannon Hulst, WHSG and Cape Cod Cooperative Extension
11:45 – 1:00 -- LUNCH. Lesson plans, standards, and classroom integration discussion. Free time to walk around Woods Hole village.
1:00 – 1:15 -- Split into 2 groups and proceed to afternoon sessions
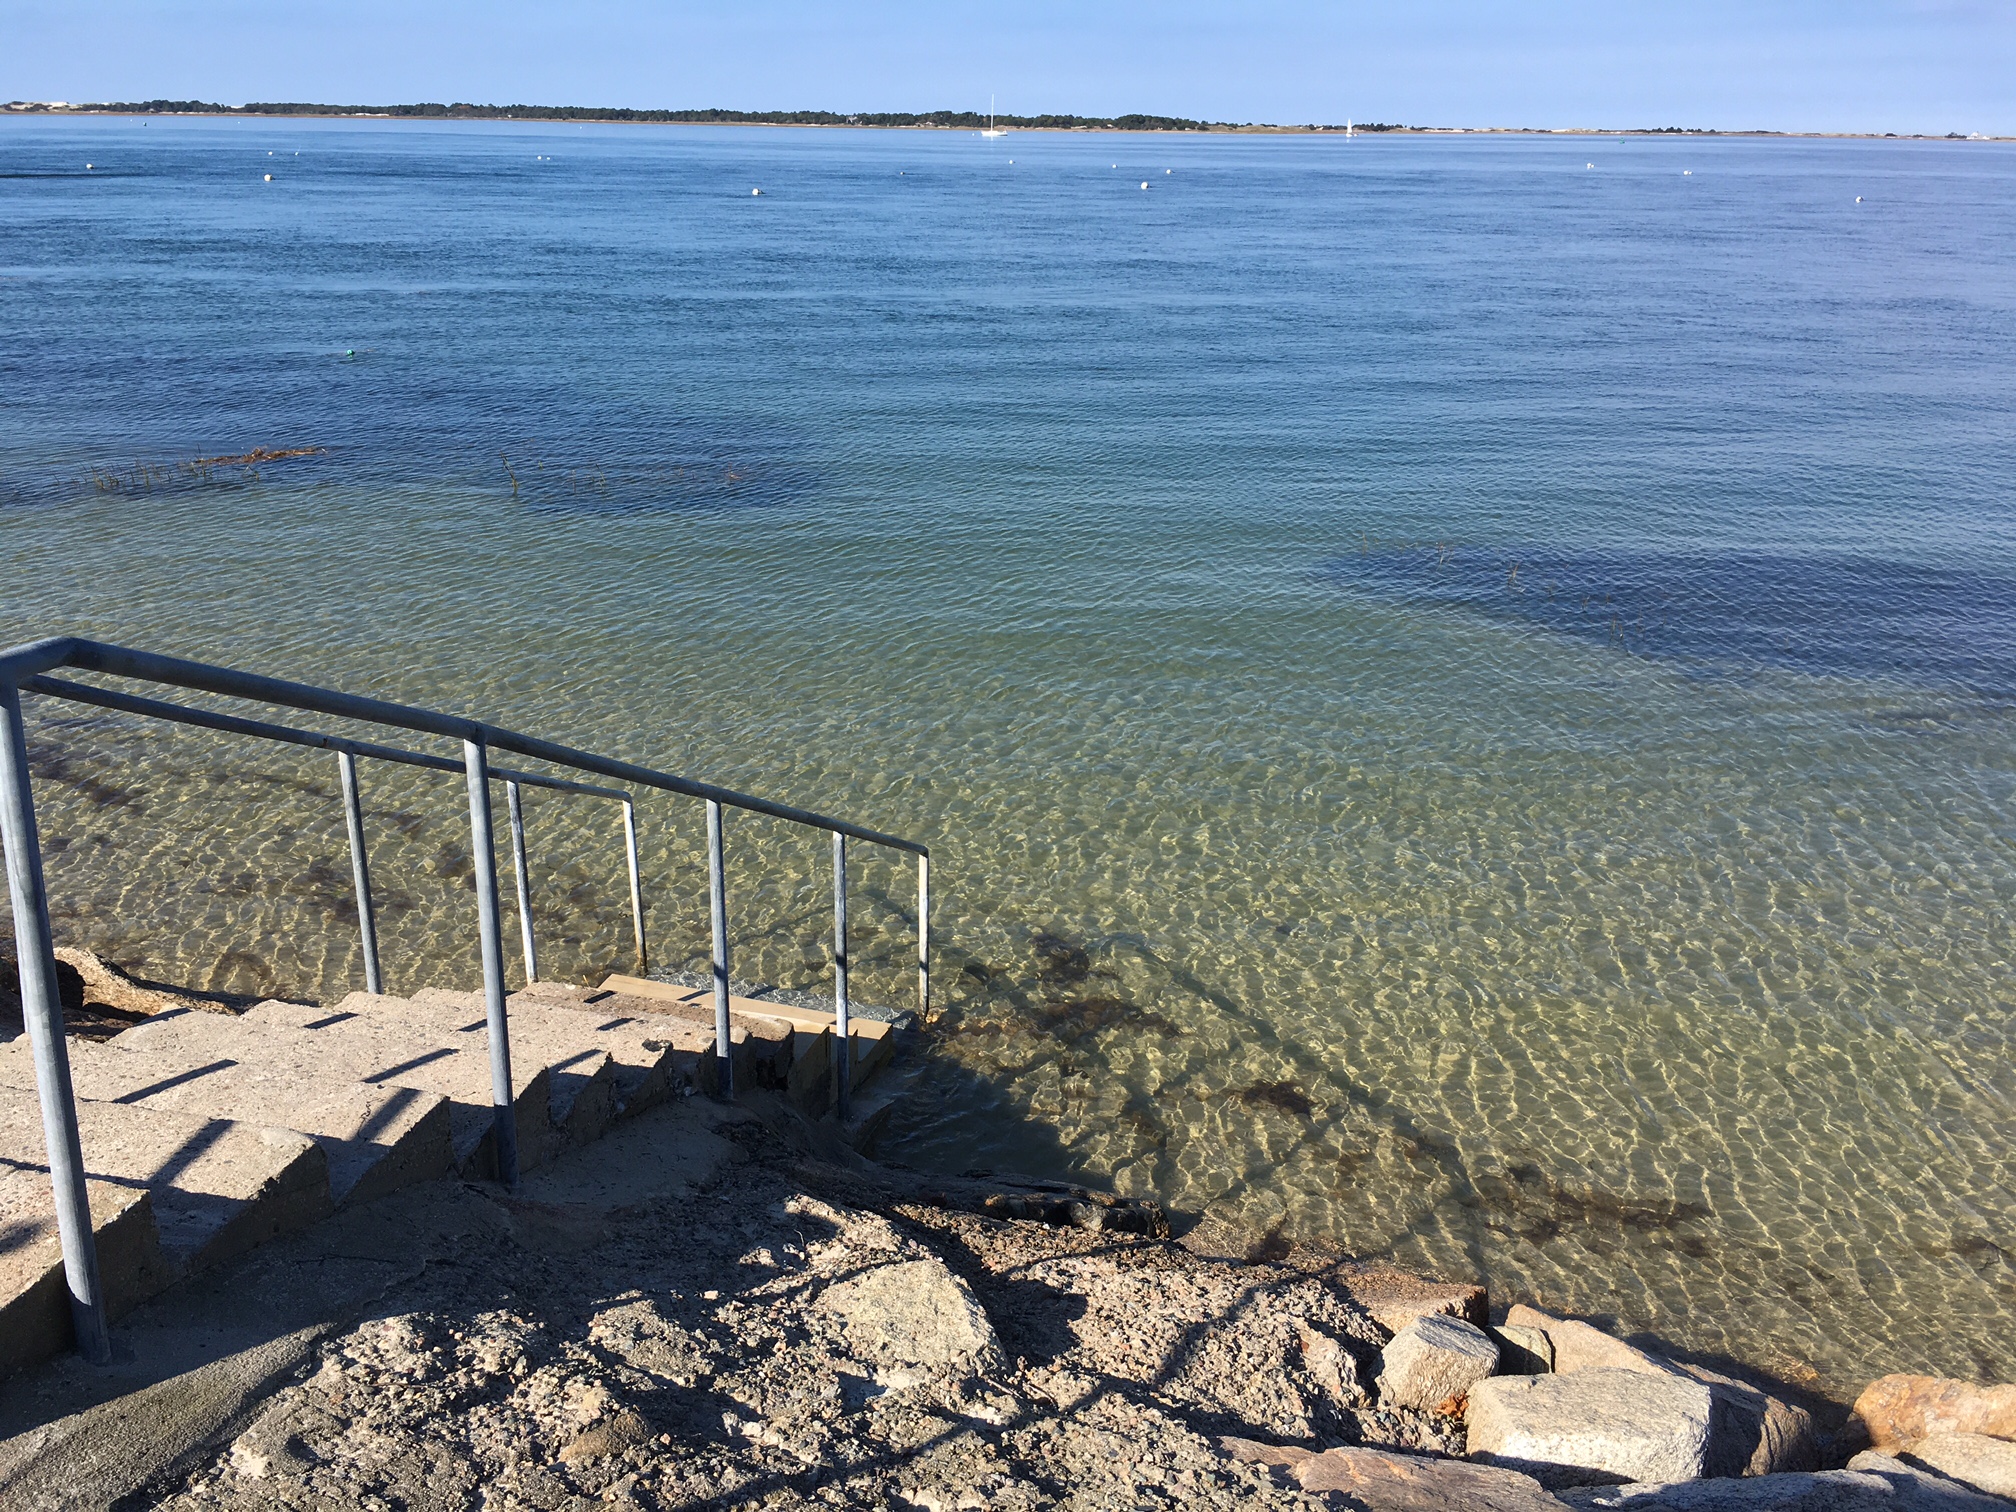
1:15 – 2:15 -- Group 1 - Field trip to beach (Sea Level Rise Markers). Group 2 - hands-on classroom activities.
2:15 – 3:15 -- Groups swap locations
3:30 - 4:00 -- Hand out PDP's and Wrap Up