Fishing for Data: Real world applications for oceanographic observations

Presenters
Melissa Sanderson, Cape Cod Commercial Fishermen’s Alliance and George Maynard, NOAA Fisheries Northeast Fisheries Science Center - Collaborating with the Commercial Fishing Industry to Monitor Ocean Conditions off the Northeastern United States, Presentation Slides
Caroline Ummenhofer and Finn Wimberly, WHOI Physical Oceanography Department - Fishing for Data, Real world applications for oceanographic observations, Presentation Slides
Date: January 23, 2026
Next Generation Science Standards Connections:
MS Ecosystems: Interactions, Energy, and Dynamics
- LS2-1. Analyze and interpret data to provide evidence for the effects of resource availability on organisms and populations of organisms in an ecosystem.
- LS2-2. Construct an explanation that predicts patterns of interactions among organisms across ecosystems.
- LS2-4. Construct an argument supported by empirical evidence that changes to physical or biological components of an ecosystem affect populations.
MS Growth, Development, and Reproduction of Organisms
- LS1-5. Construct a scientific explanation based on evidence for how environmental and genetic factors influence the growth of organisms.
MS Engineering Design
- ETS1-1. Define the criteria and constraints of a design problem with sufficient precision to ensure a successful solution, taking into account relevant scientific principles and potential impacts on people and the natural environment that may limit possible solutions. Crosscutting concepts: The uses of technologies and limitations on their use are driven by individual or societal needs, desires, and values; by the findings of scientific research; and by differences in such factors as climate, natural resources, and economic conditions.
Lesson Plans, Classroom Activities, Visualizations, and Data:
- eMOLT lesson plans
- These NOAA Fisheries Northeast Fisheries Science Center and Fishermen’s Alliance lesson plans provide place-based lessons rooted in Massachusetts data that will give your students background information on topics involving Oceanography, Fisheries, Water Quality, Marine Biology, Data Manipulation and Analysis, and much more! Each lesson includes Next Generation Science Standards and Massachusetts Framework associated with the topics covered.
- Investigating the density and stratification in the ocean
- This lab will help students demonstrate basic data literacy in graph interpretation by identifying changes in temperature, salinity and density with water depth.
- Explain how temperature and salinity relate to density stratification and stability of water masses in the ocean.
- What causes ocean stratification activity
- Students will investigate ocean stratification using real-world data, measure the density of various fluids, construct and experiment with a physical model of ocean layers, and compare real-world data with model properties.
- Climate Reanalyzer
- This page allows your students to explore today’s weather maps, hourly forecast maps, latest U.S. satellite images, climate charts, and much more!
- Cape Cod Ocean Watch
- This webpage includes an interactive tool to visualize the collected profiles while also providing additional information about current conditions. These include: maps of sea surface temperature, salinity, and chlorophyll-a concentrations, measured by satellite; ocean bottom conditions generated by profiles and aggregated by FishBOT; and monthly averages and time series for temperature, salinity, and density metrics.
- Websites to allow your students to visualize marine heatwaves
- Accessing Data Collected by Commercial Fishermen – the data portal
- Data from ERDDAP - Direct access to all of the oceanographic data collected by CFRF
- Data from ShelfDash - Dashboard to view CTD casts made by the Shelf Research Fleet in real-time.
- Data from WindDash - Interactive dashboard for viewing aggregated CTD casts made on wind farm surveys.
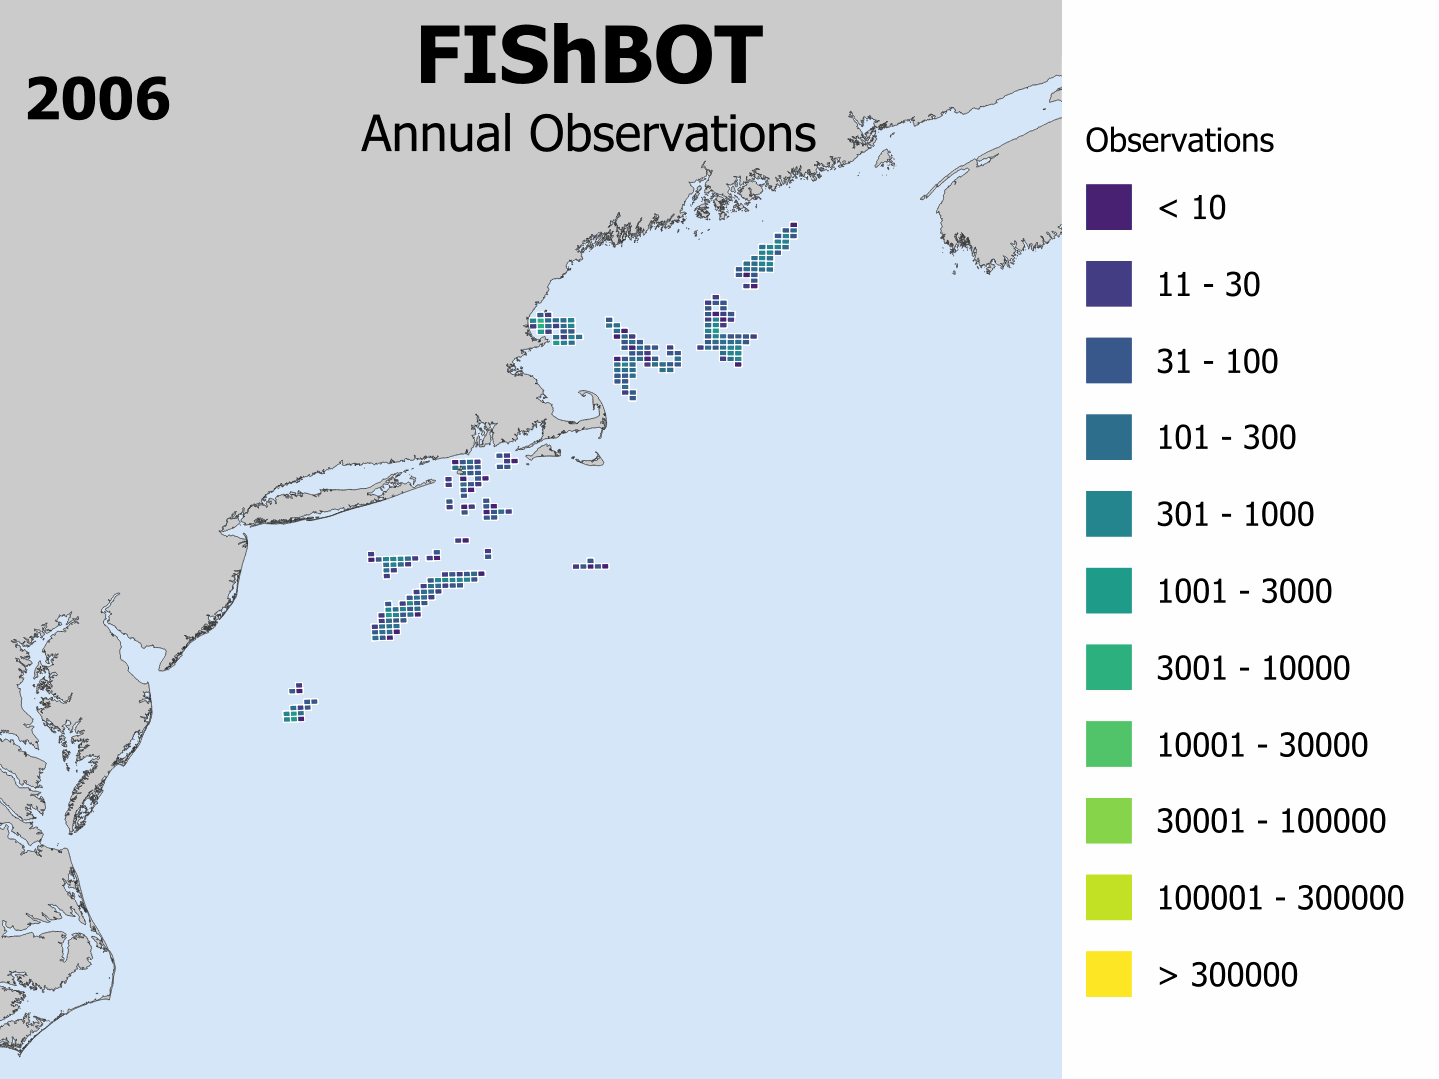
- Data from FishBOT – This is aggregated bottom temperatures from various sources
- Fishing For the Future classroom simulation
- Students will simulate fishery activity in different oceans. As students progress through the fishing seasons, they will likely overfish their oceans and have to migrate to other oceans to meet their needs. Most groups will create a total crash of fish stocks.
- Water tank stratification demonstration (SHORT)
- This visually demonstrates the principle of stratification caused by differences in water density, using fresh water and salt water in a controlled tank setup. Demo from workshop.
- Tank Experiment (LONGER)
- This activity allows the students to investigate the effects of temperature and salinity on density and stratification. It is the longer version of what was done at the workshop.
Ocean Observatories Initiative and Argo Program Background (this was the afternoon field trip)
- About the Argo Program.
- WHOI’s page about the Argo Program. Launched in 1999, Argo is a global array of floating robots that collect information about the physical state of the upper ocean, including temperature and salinity. The basic goal of Argo is to track where heat and salinity are changing across the global ocean, down to a depth of 2000 meters.
- NOAA Global Ocean Monitoring and Observing Website on Argo
- This provides useful information about the program, has links to the Argo program in the news, and a good infographic illustrating the how the floats work.
- University of California San Diego’s website on Argo
- This site has data visualizations, movies and pictures of Argo floats being prepped and launched, information about the float technology, links to Argo data, and more!
- NSF Ocean Observatories Initiative Website
- The Ocean Observatories Initiative (OOI) is a science-driven ocean observing network that delivers real-time data from more than 900 instruments to address critical science questions regarding the world's oceans. Funded by the U.S. National Science Foundation to encourage scientific investigation, OOI data are freely available.
- OOI provides continuous data from fixed-depth moorings and gliders, which complements the broader, spatial data collected by the global array of Argo profiling floats. Both initiatives are part of the larger scientific effort to understand climate-driven changes in the ocean, including heat absorption, carbon, and ecosystem resilience.
- WHOI Instruments
- This link provides images and information about instruments used at WHOI to monitor the ocean.
Background and Resources:
- Keywords and their definitions
- Background slides on the changing New England Shelf
- NASA storymap, “A Fresh Perspective Synergies between art and science to spread awareness of Marine Heatwaves.”
- NASA storymap, “The Art in the ArcTic Four paintings merge Arctic science and art.”
- Gulf of Maine warming updates
- Why Is the Gulf of Maine Warming Faster Than 99% of the Ocean? 2018 article in EOS
Deeper Exploration: Papers in Scientific Journals (pdfs included on your drive in “Deeper Exploration” folder)
- Capotondi, et al. (2024) A global overview of marine heatwaves in a changing climate. Communications Earth & Environment.
- Cheng, et al. (2025) Ocean stratification in a warming climate. Nature reviews earth & environment.
- Greene (2016) North America's Iconic Marine Species at Risk Due To Unprecedented Ocean Warming. The Oceanography Society.
- Holbrook, et al. (2020) Keeping pace with marine heatwaves. Nature reviews earth & environment.
- Mills, et al. (2020) Fisheries Management in a Changing Climate. Lessons from the 2012 Ocean Heat Wave in the Northwest Atlantic. Oceanography.
- Morris, et al. (2021) Monitoring Boundary Currents Using Ocean Observing Infrastructure. Frontiers in Ocean Observing: Documenting Ecosystems, Understanding Environmental Changes, Forecasting Hazards.
- Neto, et al. (2021) Changes in the Gulf Stream preceded rapid warming of the Northwest Atlantic Shelf. Communications Earth & Environment.
- Oliver, et al. (2021) Annual Review of Marine Science Marine Heatwaves. Annual Reviews.
- Ryan, et al. (2024) Seasonal and Interannual Salinity Variability on the Northeast U.S. Continental Shelf: Insights From Satellite Sea Surface Salinity and Implications for Stratification. Journal of Geophysical Research: Oceans.
- SenGupta, et al. (2020) Drivers and impacts of the most extreme marine heatwaves events. Scientific reports.
- Smith, et al. (2023) Annual Review of Marine Science Biological Impacts of Marine Heatwaves. Annual Reviews.
Workshop Agenda
Friday, January 23, 2026
8:45 – 9:15 -- Arrive WHOI Clark Laboratory. Breakfast: pastries, coffee, juice, tea, water
9:15 – 9:30 --Introduction to WHOI and WHOI Sea Grant
9:30 – 10:30 -- Melissa Sanderson, and George Maynard
10:30 – 10:45 -- Break
10:45 – 11:45 -- Caroline Ummenhofer and Finn Wimberly
11:45 – 1:00 -- LUNCH. Lesson plans, standards, and classroom integration discussion.
1:00 – 1:15 -- Split into 2 groups and proceed to afternoon sessions
1:15 – 2:15 -- Group 1 - Tour of oceanographic instruments and WHOI tech. Group 2 - hands-on classroom activities.
2:15 – 2:30 -- Groups swap locations
2:30 – 3:30 -- Repeat of Activities
3:30 - 4:00 -- Hand out PDPs and take survey
Contact
Grace Simpkins
gsimpkins@whoi.edu